
Cartographic Compression
Cartography is the practice of making maps. In the narrowest sense, a map is a symbolic depiction of geographic, spatial information, inscribed onto a two-dimensional surface. In a broader sense, a map is an abstract representation of information about any domain, spatial or otherwise - "abstract" in the sense that certain features or kinds of information are highlighted to the exclusion of others. But not every abstract representation is a map. Maps have axes, usually at least two; they elucidate relationships between features of the domain; and they are useful for orienting, navigating, or engaging in goal-directed behavior within that domain.
Maps that are inscribed on some kind of surface - paper, clay, rock, or an electronic screen - are useful for sharing, pointing at, and comparing with the domain. But the cognitive capacity for map-style thinking likely precedes cartographic inscription. Intimate familiarity with the domain, viewed through the special attention-directing lens of language, is enough to generate mental maps in different minds that are verifiably highly similar.
The cognitive scientist Lera Boroditsky describes a cognitive change that happened to her while spending time among speakers of the Kuuk Thaayorre language in Pormpuraaw, Queensland, Australia. This language, like a third of all human languages, has the property of absolute direction reckoning: cardinal directions are used instead of relative directions like left and right. Relating one's directional orientation is the proper response to the most common greeting, "where are you heading?" - and small children can easily report their directional heading from a list of over eighty possibilities. Boroditsky found reporting her exact directional orientation difficult at first, and suspects that she was considered intellectually dim for not being able to report her orientation. But after some practice, she experienced a radical change in her internal cartography:
After about a week of being there, I was walking along, and all of a sudden I noticed that in my head there was an extra little window, like in a video game. And in that console window was a bird's-eye view of the landscape that I was walking on, and I was a little red dot that was traversing that landscape.
Boroditsky shared the cognitive change she experienced with a native speaker of the language, who commented, "well of course - how else would you do it?"
Mental cartography, with some assistance from language and social pressure, can be as sophisticated and useful as paper or electronic maps. And when external maps are shared, they are compared not only to the terrain, but to the internal mental maps of each participant. The usefulness of externalized cartography relies on the shared capacity for internal cartography.
Aboutness Extraction
In the next section I will argue that herbivore trails can be regarded as maps. What about the "trails" created and used by slime molds? In order to explain why the former, but not the latter, is a map, I will distinguish two forms of intelligence.
The most primordial kind of intelligence is awareness of relevant features in the environment, coupled with responses to relevant information. This environmental awareness-response type of intelligence only makes sense in the light of goals (“relevant” to what?) – from a single-celled organism responding to the presence of food by consuming it, to a human noticing that a plant is dry and watering it.
Evolution itself has acquired a great deal of intelligence; DNA is the transmissible record of the information evolution has acquired about the environment, from the perspective of billions of organisms with future existence as a “goal.” Simple organisms are still very viable, but the computational process of evolution has revealed that increasingly complex organisms that extract a great deal of information (and energy) from their surrounding systems are also extremely viable, especially over short time frames. Organisms have evolved increasingly complex neural systems and senses that reach into new domains of relevant information. Humans have created instruments that do the same.
The “intelligence” apparently contained in complex economies (the “invisible hand” of the market, ecosystems) is of the awareness-response type.
Human intelligence includes awareness and response to the environment, but adds a new feature – extracting information from other intelligences, and communicating information as well. This type of intelligence also makes no sense apart from the concept of “goals” – and part of the complexity of the problem of communication and aboutness-extraction is that communication partners have some shared and some competing goals.
Sometimes people comment that they’re surprised that the problem of computer translation of languages has not been solved. Extracting the meaning from language – the story or concept communicated by the words – is an extremely hard problem that humans specialize in. It is not inherent to intelligence itself. A self-modifying super-intelligent being with vast computational resources could likely maximize its existence and reproduction goals with only the awareness-response type of intelligence – language and communication might prove to be a hindrance, a possibility explored in Peter Watts' novel Blindsight.
A special type of intelligence is the organization of complexity into a simpler, less resource-intensive form. The experience of such a compression is what is called “insight,” and it is pleasurable for humans even when not relevant to survival. The complementary tool, humor, offers a pleasant sensation as a reward for weeding one’s model for inconsistencies, though as with compression and music, it has many social applications. Compression is likely one of the regularities in subjective aesthetic judgment.
This type of intelligence makes sense even without reference to goals – but reducing complexity only makes sense given limited processing power and storage space, a feature as important to human intelligence as cognition being localized within many separate minds. An elegant compression is often itself the “aboutness” that is communicated in symbolic systems.
This is where maps (and trails) come in. Maps are compressions of the aboutness-extraction type. They represent and highlight certain features of the domain, forming a useful model, and ignore or downplay others.
Language itself acts as a store of information, shared among minds, and language tends toward compression. As stories and concepts are shared, they become more compressed, until they reach the final stage: a metonym, a single word that represents a story or concept that conversation partners are expected to understand. A word is the ultimate tl:dr for human communication. As awareness-response intelligence increases through humans acquiring new senses via technology, language grows to fill the space of understanding. And symbolic cartography grows along with language, even as domains themselves change. New models compress complex, messy observations into cheaper, cleaner, more useful patterns: natural selection, Milankovitch cycles, game theory.
An herbivore trail is an elegant compression of information. Its "aboutness" - its promise of water, seasonal pasture, rare nutrients, or something else - is available to those animals capable of extracting it.
Slime mold trails, on the other hand, are low on aboutness. They mark the places the slime mold has been, allowing it to avoid previously explored areas, but offer no promise or information about the territory other than this.
Some Territories Are Maps
Alfred Korzybski is credited with the modern proverb, "the map is not the territory." We sometimes need reminding that the thing represented and abstracted is not identical to the representation or abstraction; "magical thinking" often involves confusion of levels of abstraction and representation.
But some territories are self-mapping. In the case of herbivore trails, for example, cartographic information has been carved directly into the territory itself through years or even centuries of use. John Batali (in Trails as Archetypes of Intentionality) says that trails "are marks of passage used for passage." In order to use trails, animals must seek a destination, figure out which trail to use and in what direction, and feel some urgency about staying on the trail. This, Batali argues, is the archetypal form of technology usage.
Herbivore trails (as well as hiking trails, roads, canals, and railroads) change the territory by adding information that increases the territory's legibility and navigability. These technologies inscribe the territory with the same aboutness found in ordinary maps - useful information that can be extracted and used by savvy creatures during goal-directed behavior.
Google pagerank and search suggestions have much in common with herbivore trails. They are "marks of passage used for passage" - millions of past searchers rendering the landscape more navigable, in particular directions, for later searchers.
Two Legibilities
Legibility is the official L-word of Ribbonfarm. In the sense of Venkat's classic post, legibility refers to the perspective of a top-down, outside force shaping a system for maximum control. We might call this external legibility.

Kevin Lynch, in his 1960 book The Image of the City, offers a different perspective of legibility, or, as he calls it, "imageability": the ease of mental mapping and navigation within a system. We might call this internal legibility.
The characteristic feature of external legibility tends to be self-similarity: monoculture, grids of endlessly repeating rectangles. A territory is legible and controllable from the outside when its internal features are made very similar to each other. But the characteristic feature of internal legibility is the opposite: variety and difference. Lynch says:
[T]he sweet sense of home is strongest when home is not only familiar but distinctive as well.
It may be argued against the importance of physical legibility that the human brain is marvelously adaptable, that with some experience one can learn to pick one's way through the most disordered or featureless surroundings. There are abundant examples of precise navigation over the "trackless" wastes of sea, sand, or ice, or through a tangled maze of jungle. Yet even the sea has the sun and stars, the winds, currents, birds, and sea-colors without which unaided navigation would be impossible. The fact that only skilled professionals could navigate among the Polynesian Islands, and this only after extensive training, indicates the difficulties imposed by this particular environment. Strain and anxiety accompanied even the best-prepared expeditions. In our own world, we might say that almost everyone can, if attentive, learn to navigate in Jersey City, but only at the cost of some effort and uncertainty. Moreover, the positive values of legible surroundings are missing: the emotional satisfaction, the framework for communication or conceptual organization, the new depths that it may bring to everyday experience. These are pleasures we lack, even if our present city environment is not so disordered as to impose an intolerable strain on those who are familiar with it.
The question is: legible to whom? An environment that is very self-similar is easy to understand and control from above, but an environment that is locally distinctive is easier to navigate from within. This applies to "environments" in information space as well as spatial, geographic environments.
Cartography and Anticartography
Distinctiveness is critical for internal legibility. Maps generally represent territories in their most distinctive states: in the daytime as opposed to the dark, in summer as opposed to snow-covered winter, and with clear skies instead of covered in clouds. Common features of the landscape are abstracted away (though they may be often present) in order to present optimal distinctiveness of features.
More specifically, Kevin Lynch identifies five features that people use in their mental maps to read, image, and navigate urban environments. I will offer examples of each from Disneyland, a marvelously internally legible environment.
- Paths are "channels along which the observer potentially, occasionally, or customarily moves." In Disneyland, these include foot paths, the railroads, and even the paths that rides take through their environments.
- Edges are linear elements not considered as paths, but rather as boundaries (with different levels of permeability). The Rivers of America at Disneyland form an edge; they may be crossed by boat or canoe, and form a natural boundary to foot traffic.
- Districts are medium-to-large two-dimensional areas that the observer mentally enters "inside of." Within Disneyland, the districts are the different lands: Fantasyland, Frontierland, etc.
- Nodes are junctions (of paths) or concentrations of activity that people travel to and from, and enter into. In Disneyland, railroad stations, ride entrances and exits, and attractions like Sleeping Beauty's Castle form nodes.
- Landmarks are distinctive features of the landscape used for navigation, but used externally for navigation rather than entered into. Signs and towers are landmarks. In the case of Disneyland, the Matterhorn could be a node or landmark, depending on how it is used.
Since these are features people naturally use to make mental maps of their geographic environments, their relative richness or scarcity makes some territories more legible and navigable than others. There may be analogous features in information space, and different informational domains may be differently navigable.
An example of an anticartographic domain is the classic gambling casino. Casinos exhibit extreme local self-similarity, and similarity to each other. They are dark. Their carpets and layouts are confusing; all the paths look the same. Classically, they have no clocks, and if they have windows, they are tinted to reduce time cues. (Some casinos display large monitors with 30-second video clips of soothing views from around the world; this kind of window reduces anxiety but offers no spatial or time cues.) Both time and space navigational cues are reduced to focus attention on gambling. The classic theory exemplified by the work of Bill Friedman suggests that decoration should mostly be in the form of gambling machines; entrances and pathways should be filled with them. Ceilings should be low. Long, easily-legible hallways are to be avoided.
There is a new and more cartographic theory of casino design: playground-style casinos aim to be more similar to theme parks than to their anticartographic amusement park predecessors. This does seem to be the way of the future. The Nevada casinos have been losing money for five years straight, and meanwhile the percentage of revenue accounted for by non-gaming services (hotel rooms, food, and entertainment) has increased steadily. Over a third of the revenue of Nevada casinos now comes from non-gaming sources, which indicates a more playground-style focus. In the highest performing casinos, up to two-thirds of revenue comes from non-gaming sources; these also tend to be the most playground-like. The more cartographic, the less focus on gaming as gaming.
Information spaces may be similarly cartographic or anticartographic. They may allow for distinctiveness, features, navigability, and patterns for compression, or they may lose people in a vast, featureless wasteland.
Maps and Plots
Many years ago, my friend Jo Guldi introduced me to drawing maps. The first step is to choose axes (dimensions). Ideally, for interesting maps, you choose something more interesting than cardinal directions. Second, you plot things along your axes. But this is only the first stage of map making. Maps, as I said earlier, are not only plots of points, but represent relationships between features: paths, trade routes, nodes, boundaries, etc.
When is abstract information about a domain, presented on axes, not a map?
Here is Robert Mariani's plot of sources of journalism, whose highly original and entertaining axes are left/right (political) and bombastic-insane/reasonable.
This is a perfectly interesting plot of data, and I mean no disparagement to it when I say that it is not a map (it is not trying to be a map; he specifically calls it a "two-dimensional spectrum"). The relationship between the different plotted points is not implied. There are no paths or boundaries. In this form, it is not useful for navigating the domain that it represents - except, perhaps, for selecting media sources according to one's taste.
Maps, as Richard Francavaglia says of Disneyland, are "non-Euclidean" - in the informal sense that the shortest distance between two points is quite often not a straight line. The cities of Burbank and La Crescenta, California, are quite close together as the crow flies, but quite distant because the San Gabriel Mountains separate them. Maps reveal geographic (and social) connections, rather than just plotting directional coordinates. How social and geographical features relate to each other is much more important than their relative positions in terms of cardinal directions.
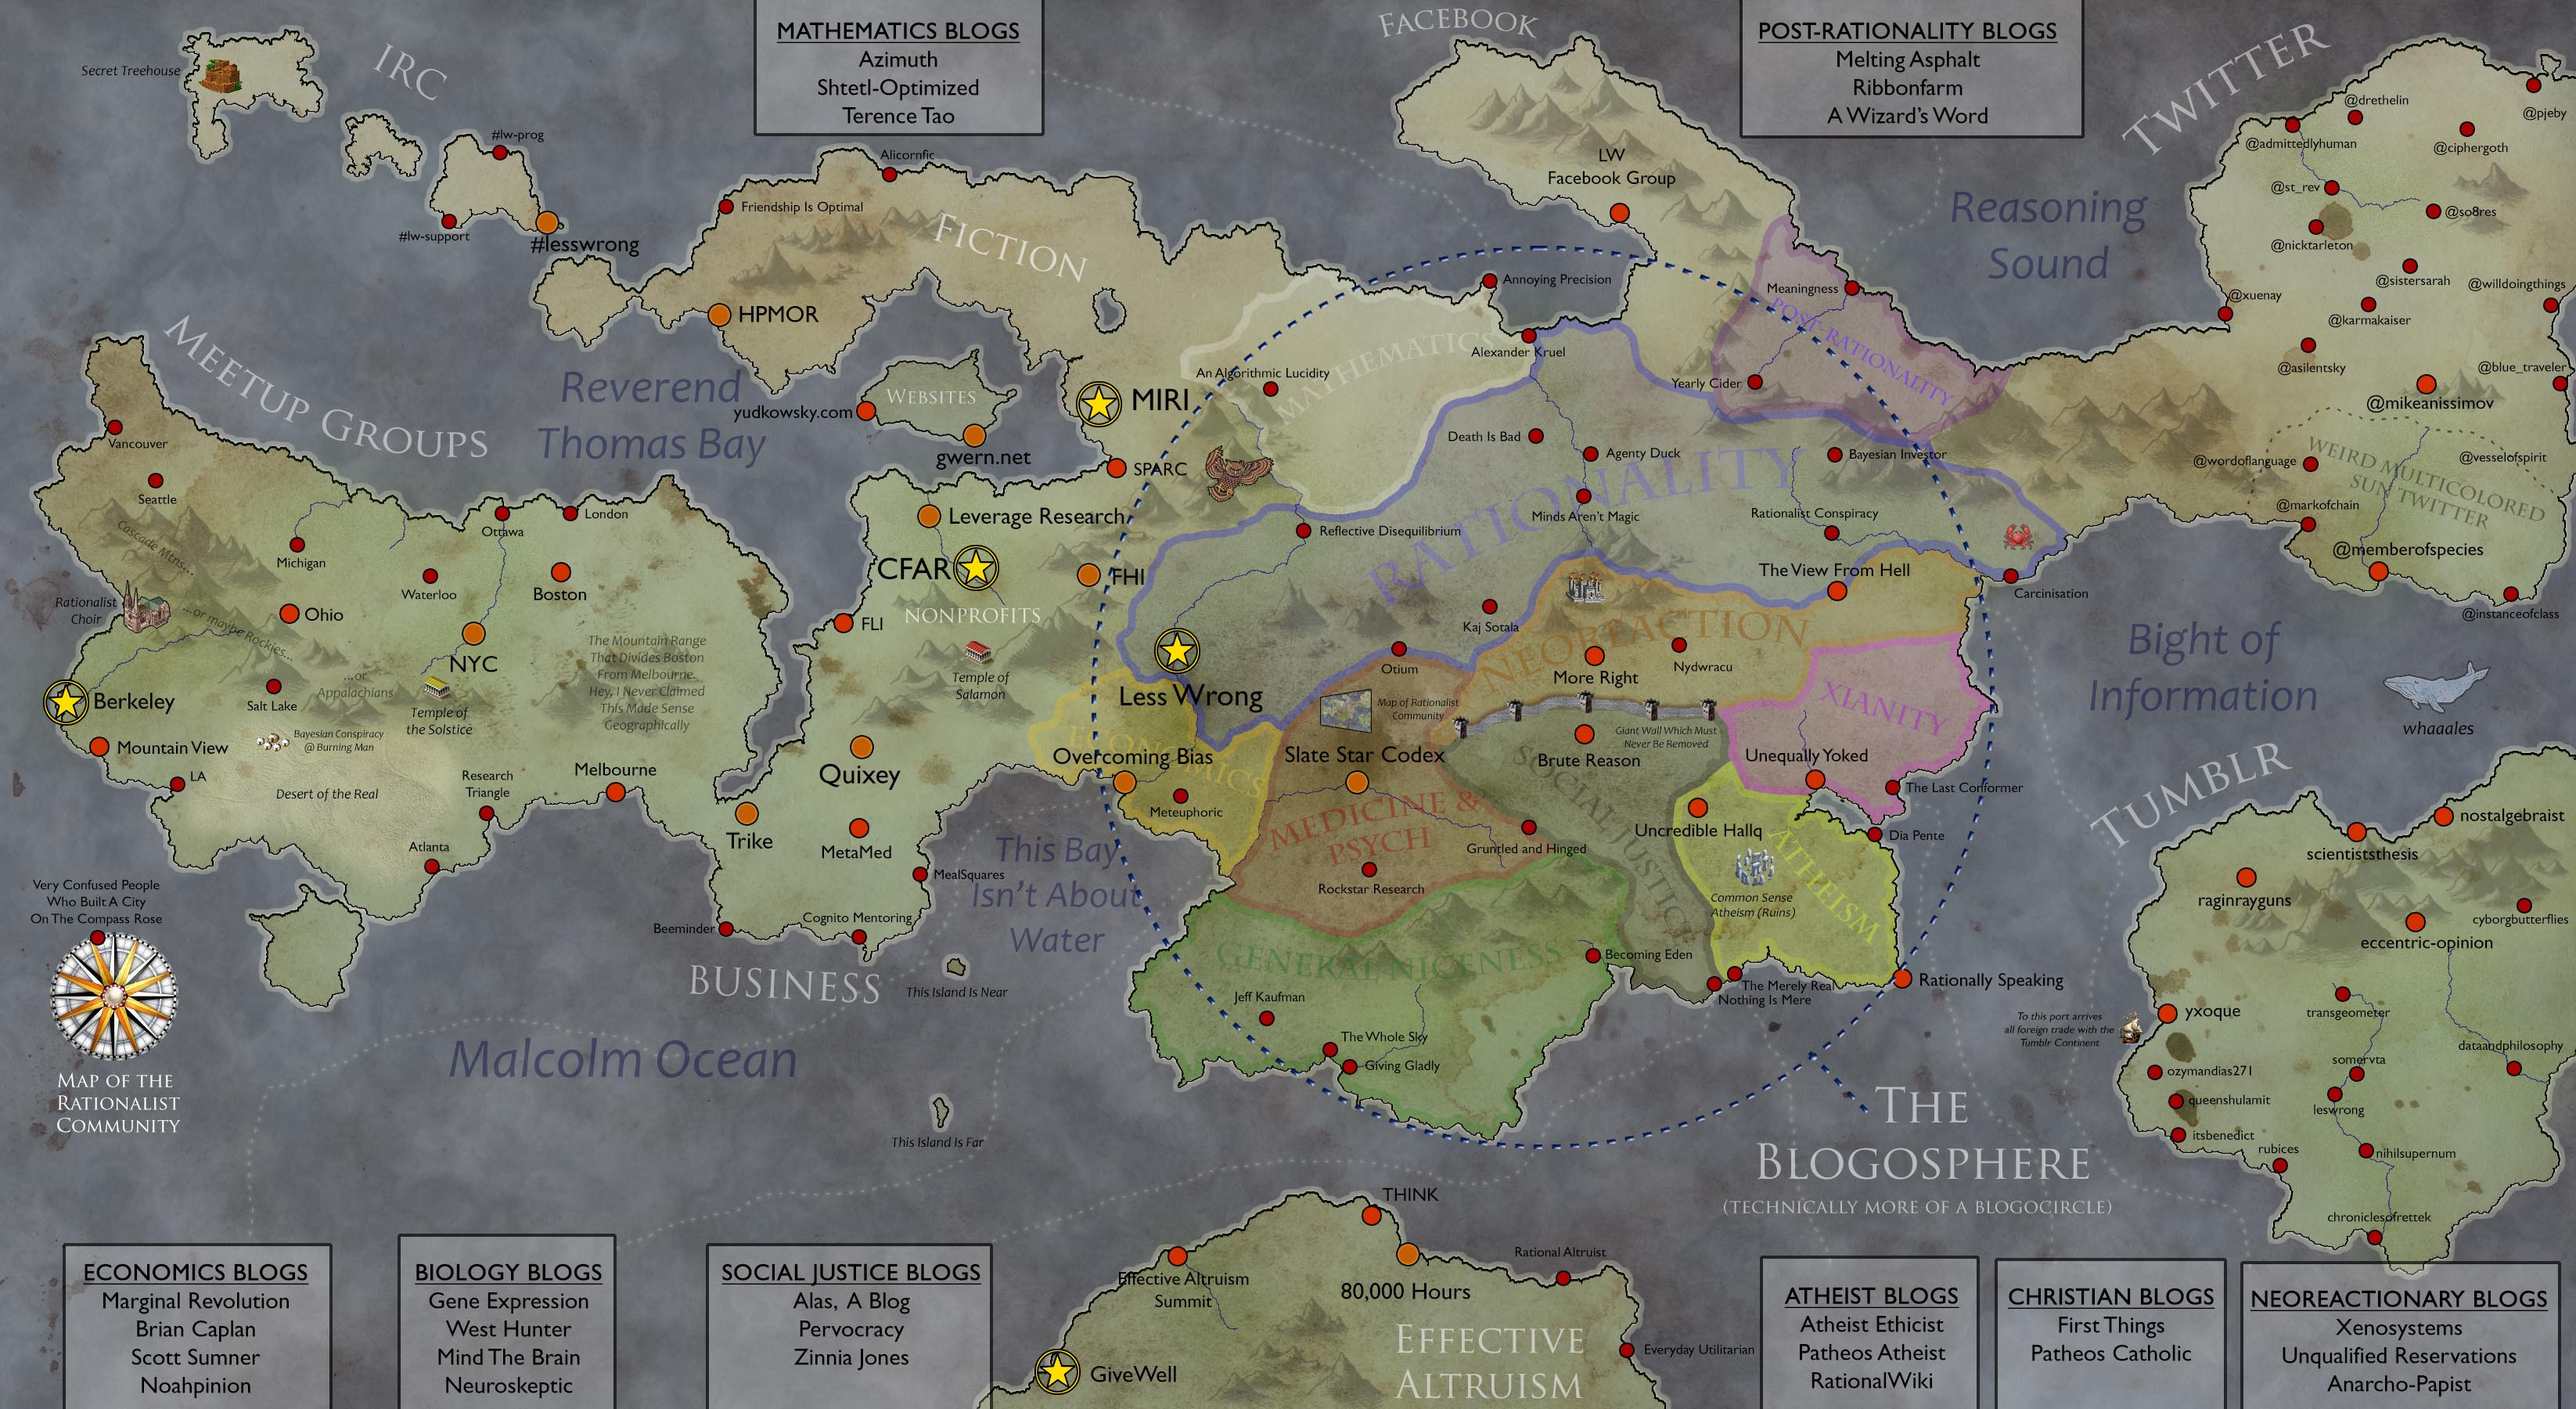
In contrast, the lovely and entertaining SlateStarCodex map of the rationalist community displays some degree of features and relationships between plotted points, offering much local distinctiveness, but has no relevant axes. Despite this, many people have found it useful for exploring areas of information space that may be "nearby" or interesting to them, simply from the portrayal and juxtaposition of points.
A Cartographic History of Cartography in One Map
As we have seen, the earliest maps were mental maps and "maps" made of information inscribed onto the territory itself. Here I have attempted to portray some aspects of the development of cartography, drawing on figures from Edward Tufte's The Visual Display of Quantitative Information.

The axes are the number of dimensions represented by the map and the level of abstraction and precision achieved. In this modest map, I have attempted to do more than plot the positions of the different maps, but to indicate their relationship. Narratives, calendars, and histories are maps of time in one dimension. Sequential art (early comic books, you might say) are similar to later, more abstract time series, but lack precise dimensions, illustrating narrative causality instead.
A sea lies between the early maps and the sophisticated efforts of "book culture" societies: the Map of the Tracks of Yu the Great was a twelfth-century map carved into stone, using a precise distance grid. It was made for people to make paper rubbings to take away and study elsewhere, making it much like a printing press. The earliest known time series, a tenth- or possible eleventh-century plot of the positions of celestial bodies, originates in the early "book consciousness" culture of monasteries. As the printing press accelerated book consciousness, the dimensionality and abstraction of maps also increased.
A ship sails on the sea; the "dead reckoning" of early ship journeys, as in absolute reckoning languages, prefigures and bridges the precision and abstraction later achieved in book consciousness. The printing press is a railroad allowing access to the higher mountains; computers are rocket ships to higher dimensions.
As the lofty heights of book consciousness are achieved, it becomes harder to see earlier forms of consciousness - because of the distance or the fog, perhaps.
The usefulness of maps is their ability to display some aspects of reality while ignoring others. It is said that all models are false, because they necessarily omit information in the interests of compression and clarity; but some models are useful, precisely because they do not represent all of reality. This is the tension expressed in Kieran Healy's recent paper, Fuck Nuance.
Humans map everything onto space, including time. We draw timelines, and refer to going forward or backward in time, way back or just ahead. Speakers of sign languages must represent time in space (in front of and behind themselves, or sometimes to the left and right), but speakers of oral languages are no less beholden to the inherent spatial metaphor.
Spatial metaphors, including maps, may make information spaces more internally legible and navigable. Encouraging features analogous to those that enable spatial navigation - paths, edges, nodes, landmarks, and districts - may reduce anxiety and increase competence and meaning when navigating information spaces. Geographic navigation may be regarded as a solved problem (just check your phone) - but information navigation has barely begun.
3 Comments
This is perfectly timed to subvert and undermine whatever the hell I am intending to convey with the new in-preparation ribbonfarm map that should be done by next week :D
Seconding the thought that applying these ideas to information-space navigation is an exciting possibility.
A compass is a good gift for a child. As is an intro to the night sky. What is the map-consciousness equivalent of literacy/numeracy?
Curious thing. Teaching English in China, I once used a map game ("Logan Town") full of L and R named destinations and routes, the goal being to train the ear to distinguish these otherwise undistinguished sounds. The lesson was a bust. But it seems the problem wasn't the challenge of distinguishing rhymes that began with L or R (Logan Road v Rogan Road) but that the students had a hard time making sense of maps and directions per se.